
STRIKING FINDINGS FROM 2023
BY: PEW RESEARCHORIGINAL SITE: PEW RESEARCH
Striking findings from 2023
Pew Research Center has gathered data around some of this year’s defining news stories, from the rise of artificial intelligence to the debate over affirmative action in college admissions . Here’s a look back at 2023 through some of our most striking research findings.
These findings only scratch the surface of the Center’s research from this past year .
1.
A record-high share of 40-year-olds in the U.S. have never been married, according to a Center analysis of the most recent U.S. Census Bureau data . As of 2021, a quarter of 40-year-olds had never been married – up from 6% in 1980.
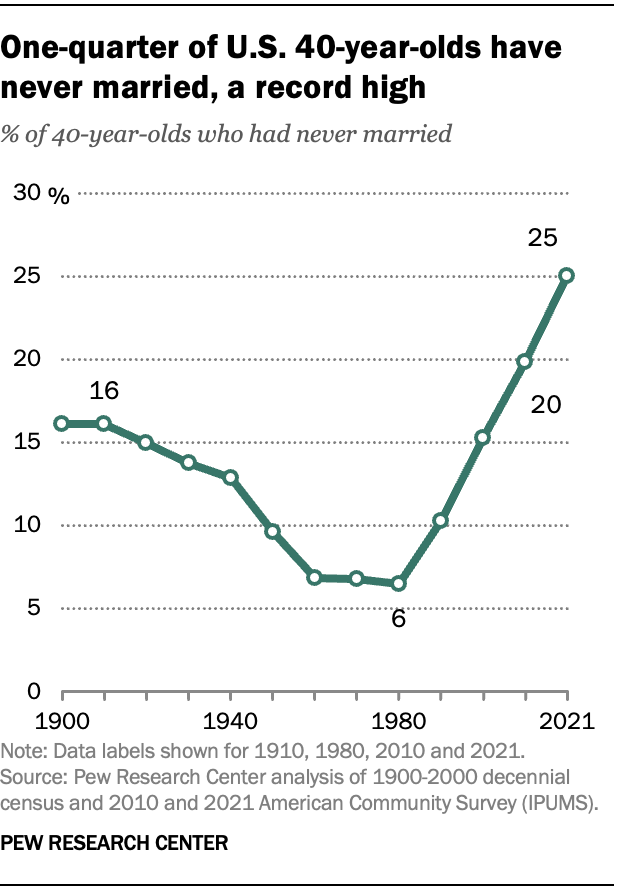
In 2021, the demographic groups most likely not to have ever been married by age 40 include men, Black Americans and those without a four-year college degree.
A Center survey conducted in April found that relatively few Americans see marriage as essential for people to live a fulfilling life compared with factors like job satisfaction and friendship. While majorities say that having a job or career they enjoy (71%) and having close friends (61%) are extremely or very important for living a fulfilling life, far fewer say this about having children (26%) or being married (23%). Larger shares, in fact, say having children (42%) or being married (44%) are not too or not at all important.
2.
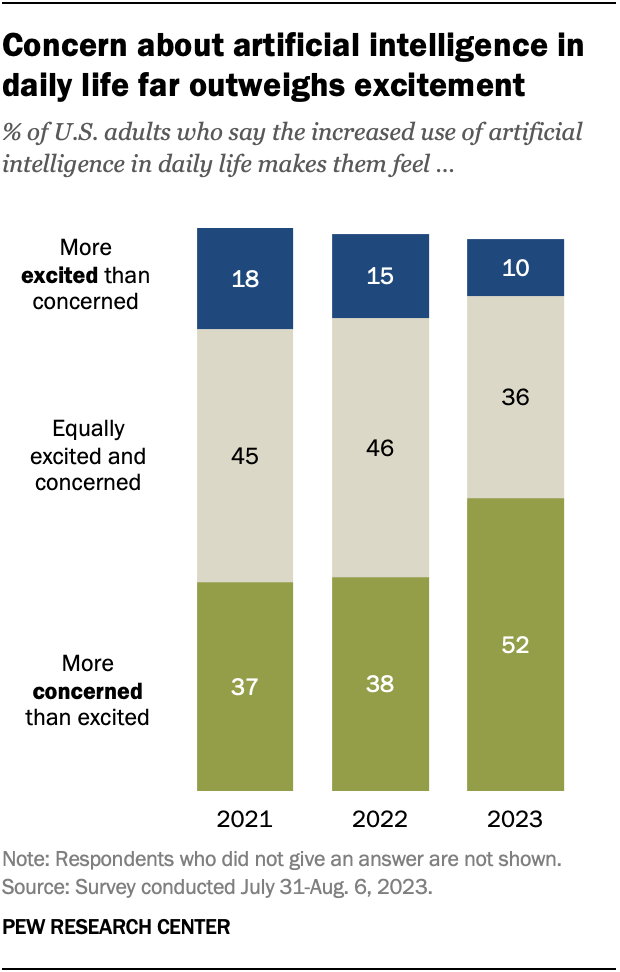
About half of Americans say the increased use of artificial intelligence in daily life makes them feel more concerned than excited – up 14 percentage points from last year, according to an August survey . Overall, 52% of Americans say they feel this way, an increase from 38% in December 2022.
Just 10% of adults say they are more excited than concerned about the increased use of AI, while 36% say they feel an equal mix of these emotions.
The rise in concern about AI has taken place alongside growing public awareness of the technology. Nine-in-ten adults say they have heard either a lot (33%) or a little (56%) about artificial intelligence. The share of those who have heard a lot is up 7 points since December 2022.
3.
For the first time in over 30 years of public opinion polling, Americans’ views of the U.S. Supreme Court are more negative than positive, a July survey found . A narrow majority (54%) have an unfavorable view of the high court, while fewer than half (44%) express a favorable one.
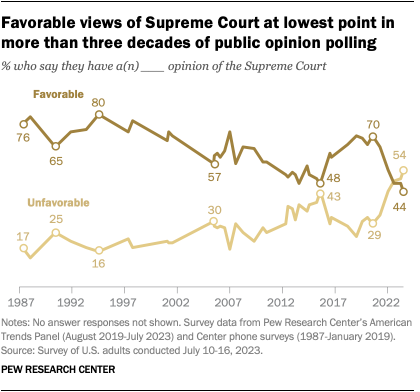
The court’s favorable rating has declined 26 percentage points since 2020, following a series of high-profile rulings on issues including affirmative action in college admissions, LGBTQ+ rights and student loans. The drop in favorability is primarily due to a decline among Democrats and Democratic-leaning independents, just 24% of whom express a favorable opinion of the court.
4.
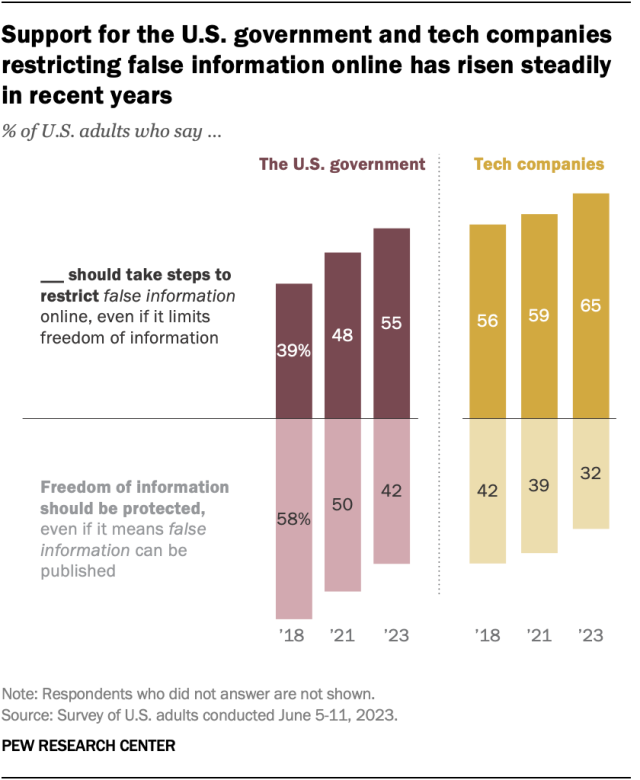
A growing share of U.S. adults say the federal government should take steps to restrict false information online, even if it limits freedom of information, a June survey found . The share of U.S. adults with this view has risen from 39% in 2018 to 55% in 2023.
In the most recent survey, 42% of adults took the opposite view, saying the government should protect freedom of information, even if it means false information can be published.
Still, Americans remain more likely to say that tech companies – rather than the U.S. government – should be responsible for restricting false information online. About two-thirds (65%) said this in June.
5.
The number of U.S. children and teens killed by gunfire rose 50% in just two years, according to a 2023 analysis of data from the Centers for Disease Control and Prevention (CDC). In 2019, there were 1,732 gun deaths among U.S. children and teens under 18. By 2021, that figure had increased to 2,590.
The gun death rate among children and teens – a measure that adjusts for changes in the nation’s population – rose 46% during that span.
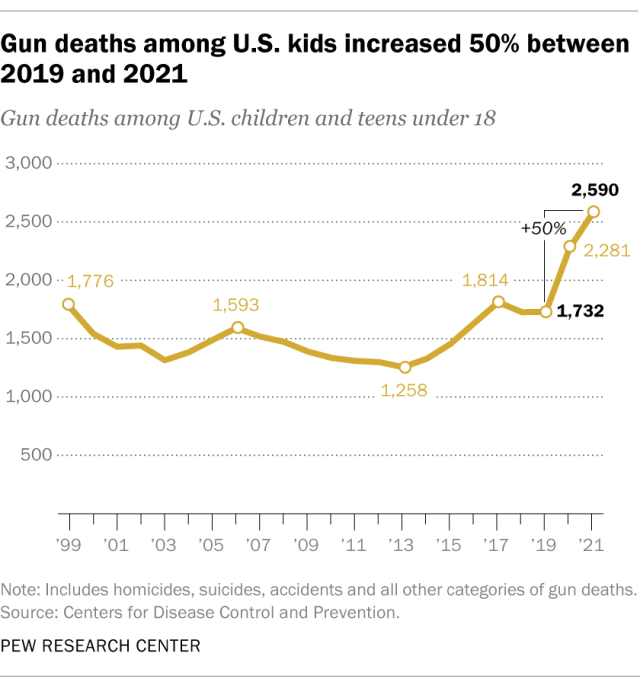
Both the number and rate of children and teens killed by gunfire in 2021 were the highest since at least 1999, the earliest year for which this information is available in the CDC’s mortality database.
6.
Most Asian Americans view their ancestral homelands favorably – but not Chinese Americans, according to a multilingual, nationally representative survey of Asian American adults .
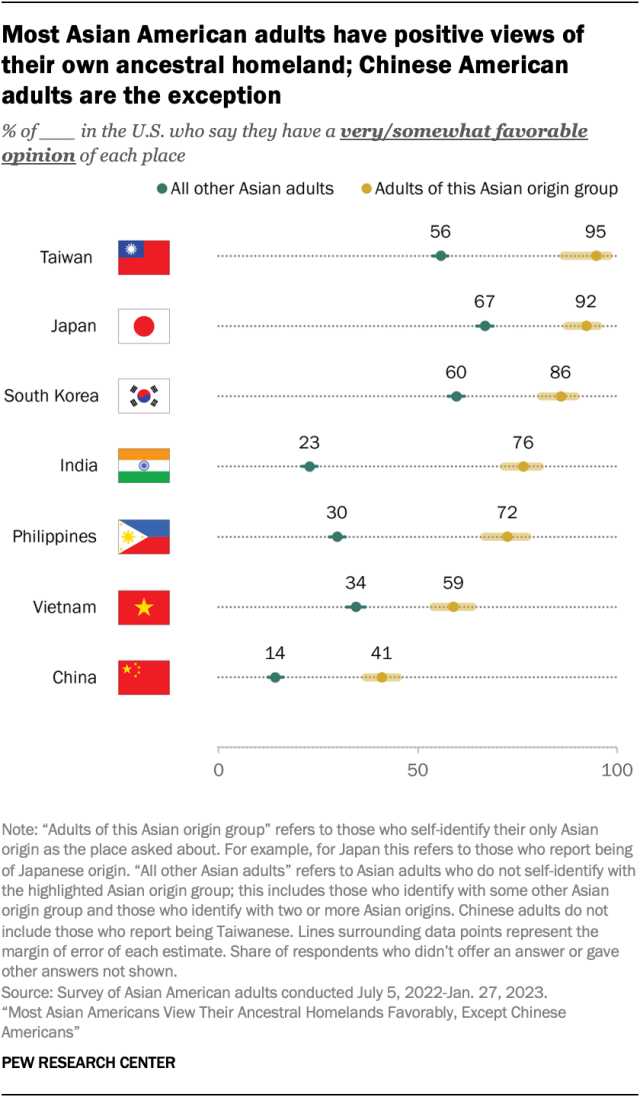
Only about four-in-ten Chinese Americans (41%) have a favorable opinion of China, while 35% have an unfavorable one. Another 22% say they have a neither favorable nor unfavorable view. This stands in contrast to how other Asian Americans view their ancestral homelands. For instance, about nine-in-ten Taiwanese and Japanese Americans have a very or somewhat favorable opinion of their place of origin, as do large majorities of Korean, Indian and Filipino Americans.
While Chinese Americans’ views of China are more mixed, they still have a more favorable opinion of the country than other Asian adults do. Just 14% of other Asian Americans view China favorably.
7.
Even before the Israel-Hamas war, Israelis had grown more skeptical of a two-state solution. In a survey conducted in March and April , prior to the war, just 35% of Israelis thought “a way can be found for Israel and an independent Palestinian state to coexist peacefully.” This share had declined by 9 percentage points since 2017 and 15 points since 2013.
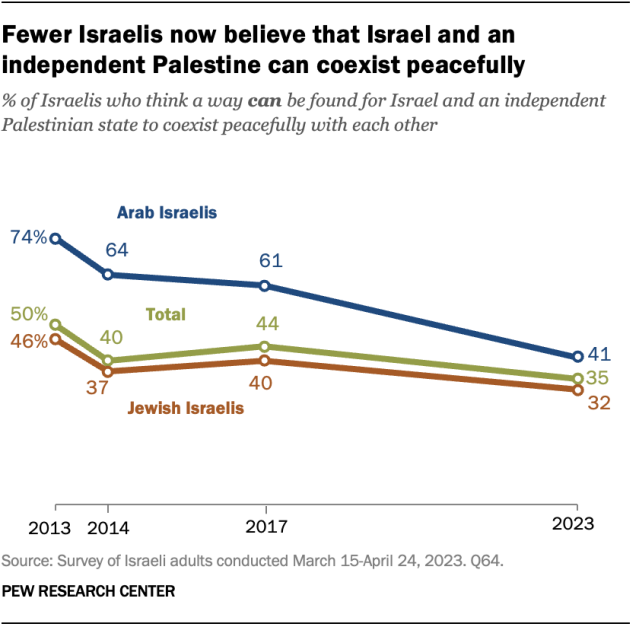
Among both Arabs and Jews living in Israel, there have been declines over the past decade in the share of people who believe that a peaceful coexistence between Israel and an independent Palestinian state is possible.
8.
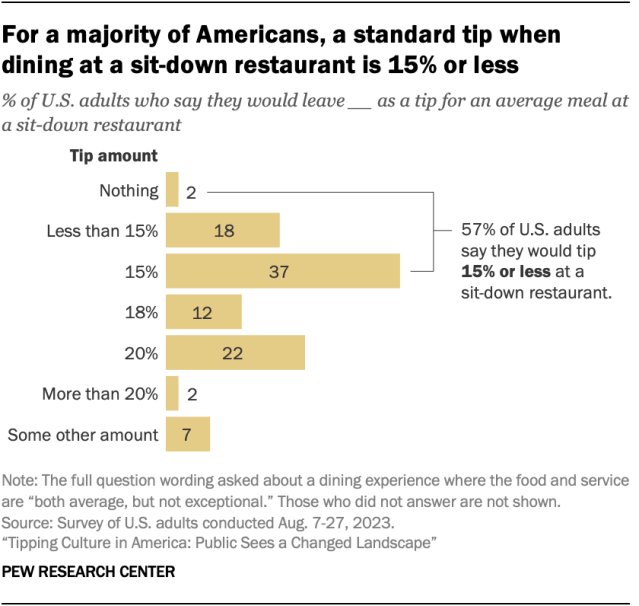
A majority of Americans say they would tip 15% or less for an average restaurant dining experience, including 2% who wouldn’t leave a tip at all, an August survey shows . The survey presented respondents with a hypothetical scenario in which they went to a sit-down restaurant and had average – but not exceptional – food and service. About six-in-ten (57%) say they would leave a tip of 15% or less in this situation. Another 12% say they would leave a tip of 18%, and a quarter of people say they’d tip 20% or more.
Adults in lower-income households and those ages 65 and older are more likely than their counterparts to say they would tip 15% or less in a situation like this.
9.
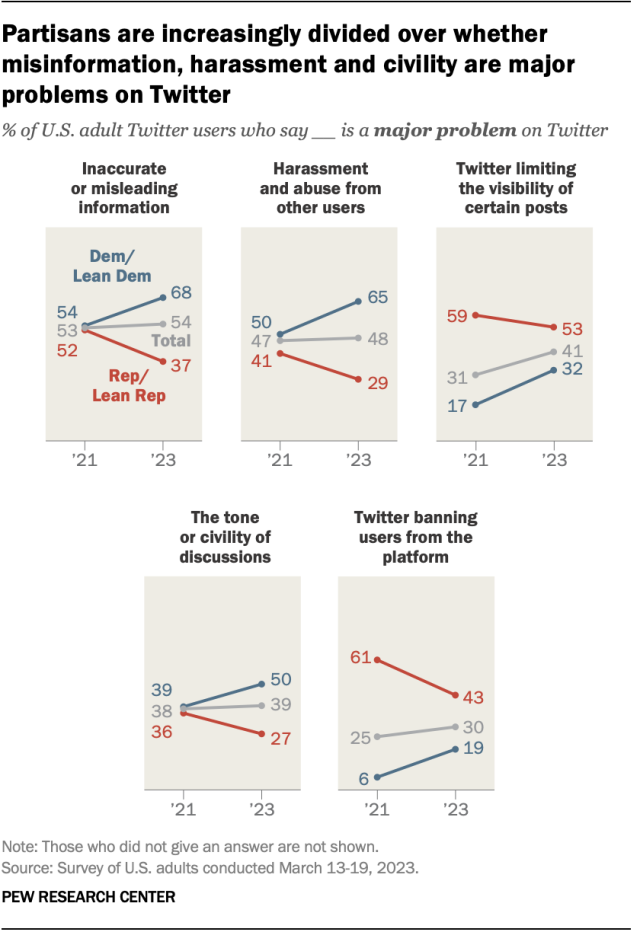
Partisan views of Twitter – the social media platform now called X – have shifted over the last two years, with Republican users’ views of the site growing more positive and those of Democratic users becoming more negative, according to a March survey . The share of Republican and GOP-leaning users who said the site is mostly bad for American democracy fell from 60% in 2021 to 21% earlier this year. At the same time, the share of Republican users who said the site is mostly good for democracy rose from 17% to 43% during the same span.
Democrats’ views moved in the opposite direction during that time frame. The percentage of Democratic and Democratic-leaning Twitter users who said the platform is good for American democracy decreased from 47% to 24%, while the share who said it is bad for democracy increased – though more modestly – from 28% to 35%.
These changes in views follow Elon Musk’s takeover of the platform in fall 2022.
10.
Nearly half of U.S. workers who get paid time off don’t take all the time off their employer offers, according to a February survey of employed Americans . Among those who say their employer offers paid time off for vacation, doctors’ appointments or to deal with minor illnesses, 46% say they take less time off than they are allowed. A similar share (48%) say they typically take all the time off they are offered.
Among those who don’t take all their paid time off, the most common reasons cited are not feeling the need to take more time off (52% say this), worrying they might fall behind at work (49%), and feeling badly about their co-workers taking on additional work (43%).
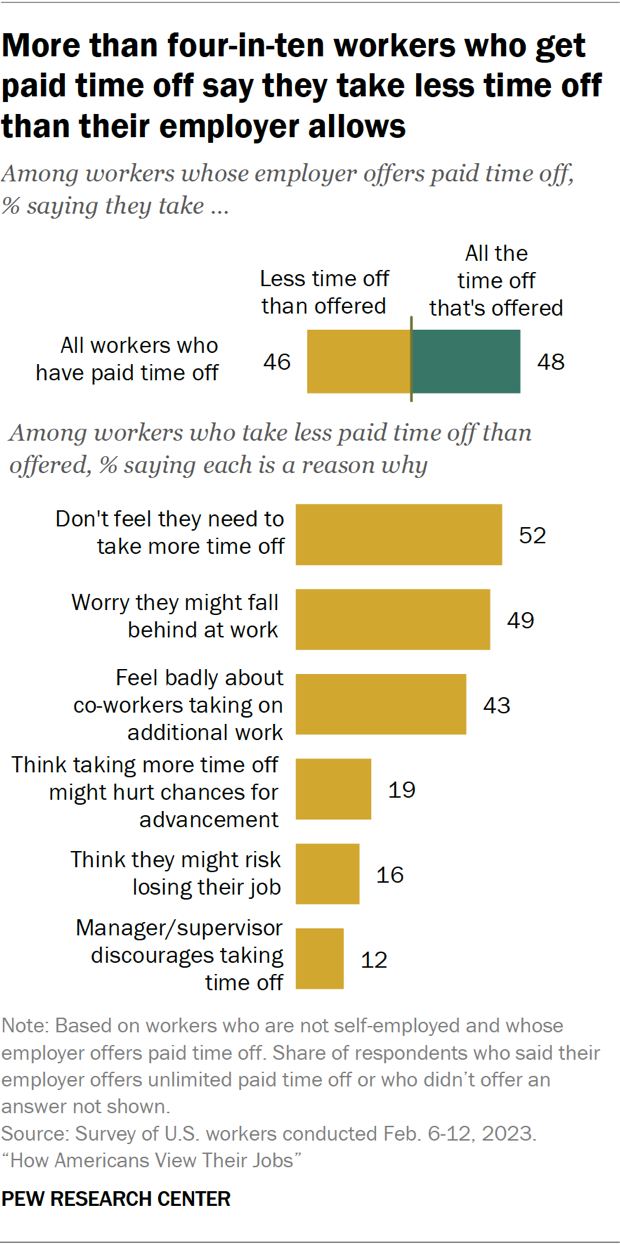
Smaller shares cite other concerns, including the feeling that taking more time off might hurt their chances for job advancement (19%) or that they might risk losing their job (16%). Some 12% say their manager or supervisor discourages them from taking time off.
11.
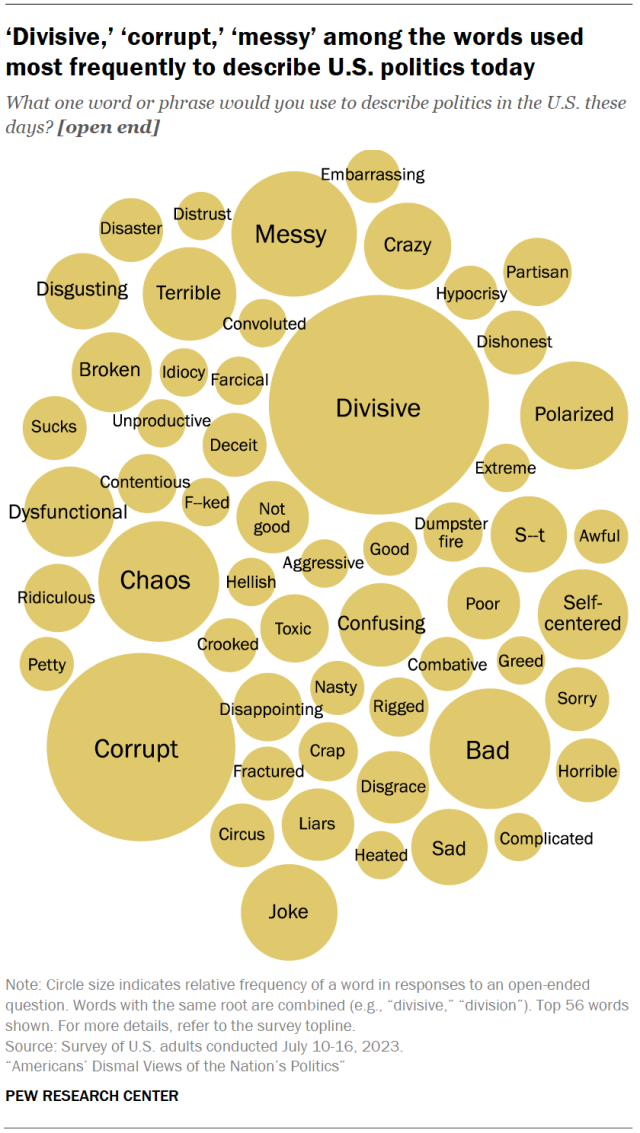
An overwhelming majority of Americans (79%) express a negative sentiment when asked to describe politics in the United States these days, a July survey found . Just 2% offer a positive word or phrase, while 10% say something neutral.
Among those who volunteered an answer, 8% use the word “ divisive” or variations of it, while 2% cite the related term “polarized.” “Corrupt” is the second-most frequent answer, given by 6% of respondents.
The top 15 most cited words also include “messy,” “chaos,” “broken” and “dysfunctional.” Many respondents are even more negative in their views: “terrible,” “disgusting,” “disgrace” and the phrase “dumpster fire” are each offered by at least 1% of respondents.
12.
Around half of Americans (53%) say they have ever been visited by a dead family member in a dream or in another form, according to a spring survey . Overall, 46% of Americans report that they’ve been visited by a dead family member in a dream, while 31% report having been visited by dead relatives in some other form.
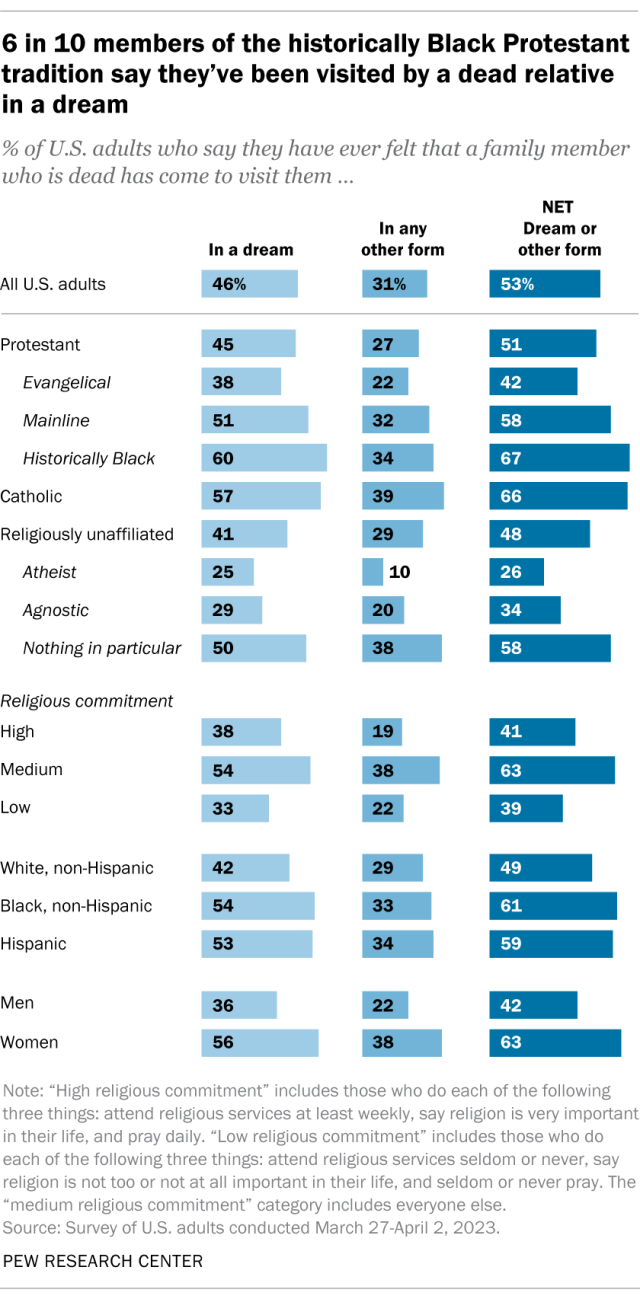
Women are more likely than men to report these experiences.
While the survey asked whether people have had interactions with dead relatives, it did not ask for explanations. So, we don’t know whether people view these experiences as mysterious or supernatural, whether they see them as having natural or scientific causes, or some of both.
For example, the survey did not ask what respondents meant when they said they had been visited in a dream by a dead relative. Some might have meant that relatives were trying to send them messages or information from beyond the grave. Others might have had something more commonplace in mind, such as dreaming about a favorite memory of a family member.
13.
More Americans disapprove than approve of selective colleges and universities taking race and ethnicity into account when making admissions decisions, according to another spring survey , fielded before the Supreme Court ruled on the practice in June. Half of U.S. adults disapprove of colleges considering race and ethnicity to increase diversity at the schools, while a third approve and 16% are not sure.
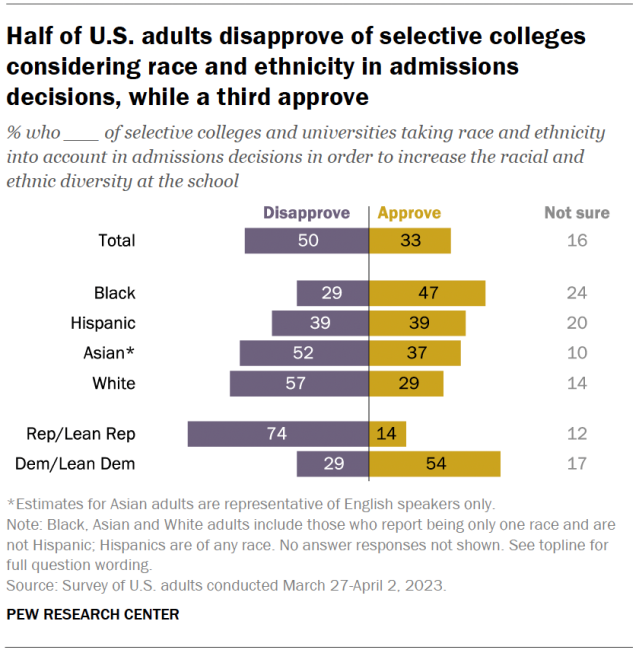
Views differ widely by party, as well as by race and ethnicity. Around three-quarters of Republicans and Republican leaners (74%) disapprove of the practice, while 54% of Democrats and Democratic leaners approve of it.
Nearly half of Black Americans (47%) say they approve of colleges and universities considering race and ethnicity in admissions, while smaller shares of Hispanic (39%), Asian (37%) and White (29%) Americans say the same.
14.
The share of Americans who say science has had a mostly positive effect on society has declined since 2019, before the coronavirus outbreak, a fall survey shows : 57% say science has had a mostly positive effect on society, down from 73% in 2019.
About a third of adults (34%) now say the impact of science on society has been equally positive and negative. And 8% say science has had a mostly negative impact on society.
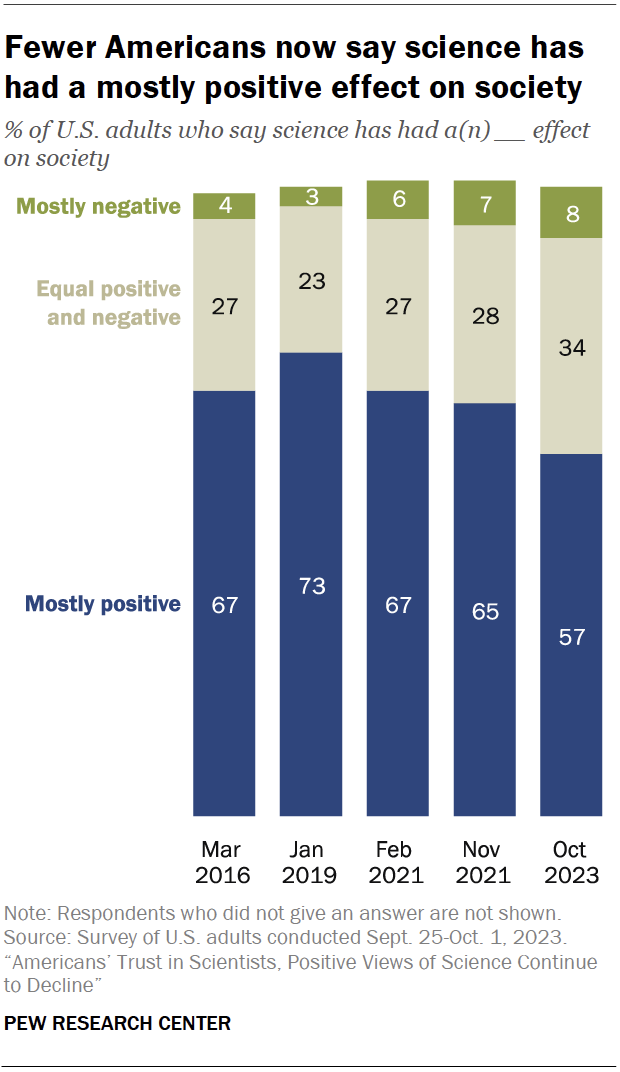
Democrats have become much more likely than Republicans to say science has had a mostly positive impact on society (69% vs. 47%). This gap is the result of steeper declines in positive ratings among Republicans than among Democrats since 2019 (down 23 points and 8 points, respectively).
15.
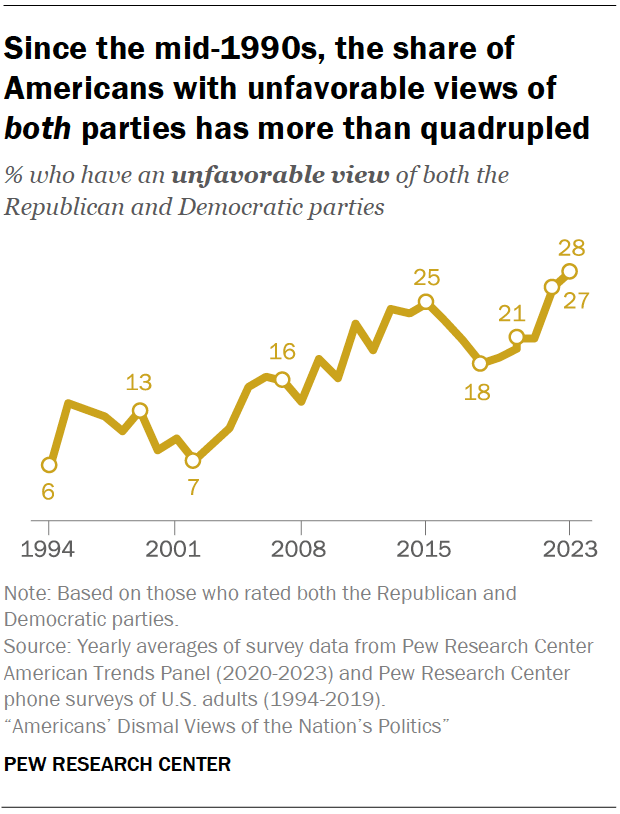
Nearly three-in-ten Americans express an unfavorable opinion of both major political parties – the highest share in at least three decades, according to a July survey . Overall, 28% of Americans have an unfavorable opinion of both the Republican and Democratic parties. This is more than quadruple the share in 1994, when just 6% of Americans viewed both parties negatively.
16.
A majority of Americans say TikTok is a threat to national security, according to a survey conducted in May . About six-in-ten adults (59%) see the social media platform as a major or minor threat to national security in the United States. Just 17% say it is not a threat to national security and another 23% aren’t sure.
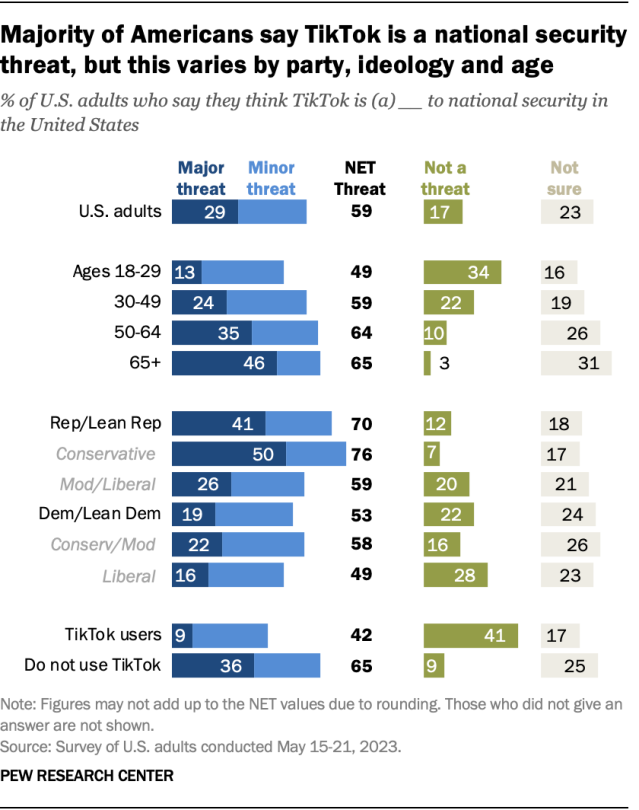
Views vary by partisanship and age. Seven-in-ten Republicans and GOP leaners say TikTok is at least a minor threat to national security, compared with 53% of Democrats and Democratic leaners. Conservative Republicans are more likely than moderate or liberal Republicans – or Democrats of any ideology – to say the view the app as a major threat.
Nearly half of those ages 65 and older (46%) see TikTok as a major threat to national security, compared with a much smaller share (13%) of adults ages 18 to 29.
AWFSM CATEGORIES
Activism | AI | Belief | Big Pharma | Conspiracy | Cult | Culture | Deep State | Economy | Education | Entertainment | Environment | Faith | Global | Government | Health | Hi Tech | Leadership | Politics | Prophecy | Science | Security | Social Climate | Universe | War
