ASIAN AMERICANS ARE THE FASTEST-GROWING RACIAL OR ETHNIC GROUP IN THE U.S.
ABBY BUDIMAN & NEIL G. RUIZ
Asian Americans recorded the fastest population growth rate among all racial and ethnic groups in the United States between 2000 and 2019. The Asian population in the U.S. grew 81% during that span, from roughly 10.5 million to a record 18.9 million, according to a Pew Research Center analysis of U.S. Census Bureau population estimates , the last before 2020 census figures are released. Furthermore, by 2060, the number of U.S. Asians is projected to rise to 35.8 million, more than triple their 2000 population.
Hispanics saw the second-fastest population growth between 2000 and 2019, followed by Native Hawaiians and Pacific Islanders (NHPI) at 70% and 61%, respectively. The nation’s Black population also grew during this period, albeit at a slower rate of 20%. There was virtually no change in the White population.
As part of our ongoing research about racial and ethnic diversity in the United States, we examined population changes over the past two decades for all major racial and ethnic groups in the U.S., including in the 50 states and the District of Columbia. This analysis is based on data from the U.S. Census Bureau’s intercensal population estimates for 2000-2009, and the Vintage 2019 population estimates for 2010-2019. These are the last population estimates before data from the 2020 census is released.
All racial groups shown in this analysis refer to single-race, non-Hispanic populations. Hispanics are of any race. The Census Bureau categorizes Asian Americans and Native Hawaiian and Pacific Islander as separate populations, based on a 1997 U.S. Office of Management and Budget revision .
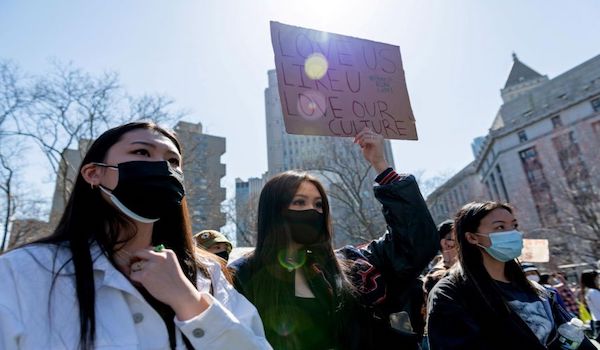
The growth of the Asian American population in the U.S. comes amid reports of discrimination and violence against this group since the start of the coronavirus outbreak . In a Pew Research Center survey conducted in early March 2021 – before the fatal shooting of six Asian women and two other people in the Atlanta area on March 16 – 87% of Asian Americans said there is a lot of or some discrimination against them in society. In a June 2020 survey , 31% of Asians reported they had been the subject of slurs or jokes since the COVID-19 outbreak began, and 26% said they had feared someone might threaten or physically attack them because of their race or ethnicity. (Asian adults in both surveys were interviewed in English only.)
Average population growth of Asian Americans has slowed over the past two decades
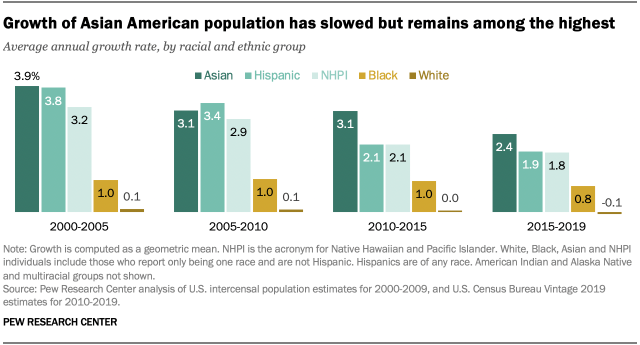
The average annual growth rate of the Asian American population in the U.S. has slowed since 2000. From 2000 to 2005, it grew by an average of 3.9% per year. It dropped to 3.1% per year between 2005 and 2010, remained at that level between 2010 and 2015, and then fell to 2.4% per year between 2015 and 2019.
Despite the slowdown, the U.S. Asian population has still had one of the highest growth rates of any major racial and ethnic group in most years since 2000. The exception was between 2005 and 2010, when the growth rate among Hispanic Americans slightly outpaced than of Asian Americans (3.4% vs 3.1% per year).
Asian American population grew in all states and D.C. between 2000 and 2019
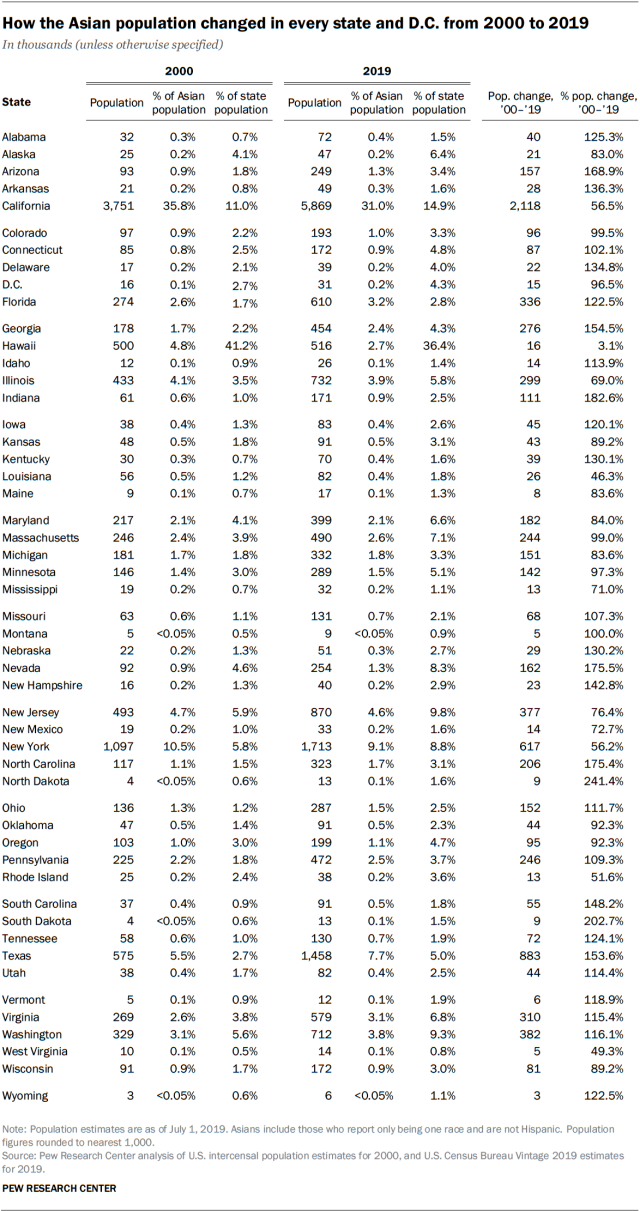
The Asian American population has increased in every state and the District of Columbia over the past two decades. California had an Asian population of roughly 5.9 million in 2019, by far the nation’s largest. It was followed by New York (1.7 million), Texas (1.5 million), New Jersey (870,000) and Illinois (732,000). A majority of U.S. Asians (56%) live in these five states.
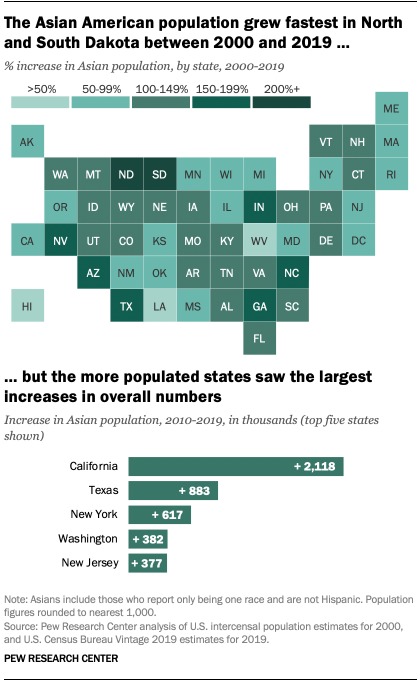
In terms of growth rates , North Dakota and South Dakota saw the fastest increases in their Asian American populations between 2000 and 2019. The Asian populations in both states more than tripled during that time. Indiana, Nevada and North Carolina also saw significant growth as their Asian populations increased by 183%, 176% and 175%, respectively.
California, Texas and New York saw the most robust numerical growth in their Asian American populations between 2000 and 2019. Together, these three states accounted for 43% of overall Asian population growth in the U.S. during that period. The number of Asian Americans grew by over 2 million in California, by 883,000 in Texas and by 617,000 in New York. Notably, the Asian population grew more in Texas than in New York during this span, even though more Asians still reside in New York.
Asian American population growth in some states surpassed the state’s overall population growth
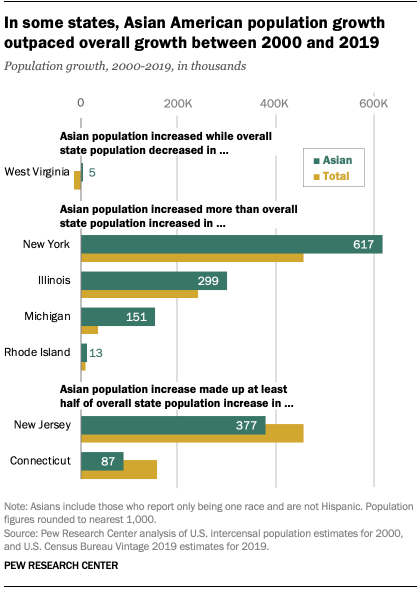
In West Virginia, the Asian population increased between 2000 and 2019 even though the state’s overall population declined. The decrease in West Virginia’s overall population can be largely attributed to a decline in the state’s White population, which makes up a majority of the state’s populace.
In four other states, increases in the number of Asian Americans between 2000 and 2019 exceeded the state’s overall population growth. That was especially apparent in Michigan, where the Asian population grew by more than four times as much as the state’s overall population (151,000 vs. 34,000). New York, Illinois and Rhode Island had similar patterns, though to a lesser degree.
In two other states, Asian Americans accounted for more than half of statewide population growth from 2000 to 2019. Asians accounted for 83% of total population growth in New Jersey and 57% in Connecticut during this span.

